Let’s talk about the last time the Houston Texans and the New England Patriots squared off. The Texans vs Patriots latest stats tell a story. Not just the final score. They whisper about battles in the trenches, quarterbacks under pressure, and a game that can turn on a single play.
This isn’t just about who won. It’s about how it all went down. We’re breaking down every crucial digit from that clash. You want the Texans vs Patriots match statistics? The Texans vs Patriots game stats? You got them.
We’re digging into the Texans-Patriots head-to-head stats, the raw Texans vs Patriots results and stats, and the nitty-gritty of the Texans vs Patriots box score. It is your all-access pass to thTexans-Patriotsts NFL game stats, decoded. So grab your virtual helmet. Let’s go.
AFC Divisional Playoffs • Jan 18, 2026
Score by Quarter
| Team | Q1 | Q2 | Q3 | Q4 | Total |
|---|---|---|---|---|---|
| Houston Texans (HOU) | 3 | 7 | 6 | 0 | 16 |
| New England Patriots (NE) | 7 | 14 | 0 | 7 | 28 |
Team Offense Snapshot
| Category | Texans | Patriots |
|---|---|---|
| Passing Yards | 212 | 179 |
| Rushing Yards | 48 | 105 |
| Total Yards | 260 | 284 |
| QB Sacks (Yards) | 3 (19) | 5 (36) |
| Turnovers (INT + Lost Fumbles) | 5 (4 INT, 1 FL) | 3 (1 INT, 2 FL) |
Passing
| QB | C/ATT | YDS | AVG | TD | INT | SACKS | RTG |
|---|---|---|---|---|---|---|---|
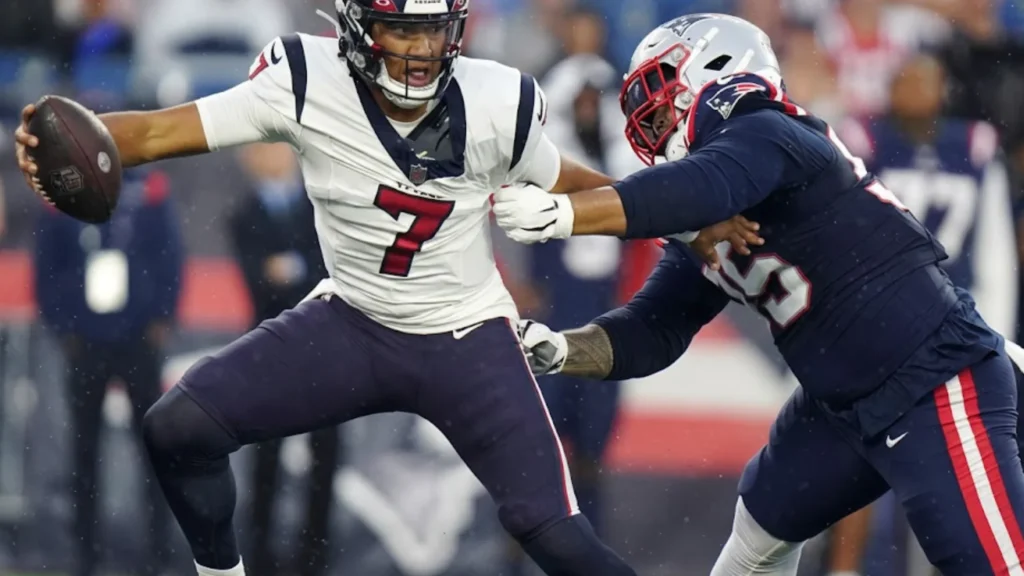
| C.J. Stroud (HOU) | 20/47 | 212 | 4.5 | 1 | 4 | 3-19 | 28.0 |
| Drake Maye (NE) | 16/27 | 179 | 6.6 | 3 | 1 | 5-36 | 100.7 |
Rushing
| Player | CAR | YDS | AVG | TD | LONG |
|---|---|---|---|---|---|
| Woody Marks (HOU) | 14 | 17 | 1.2 | 0 | 8 |
| Nick Chubb (HOU) | 4 | 14 | 3.5 | 0 | 7 |
| C.J. Stroud (HOU) | 2 | 11 | 5.5 | 0 | 10 |
| Cade Stover (HOU) | 2 | 6 | 3.0 | 0 | 4 |
| Rhamondre Stevenson (NE) | 16 | 70 | 4.4 | 0 | 20 |
| TreVeyon Henderson (NE) | 12 | 25 | 2.1 | 0 | 6 |
| Drake Maye (NE) | 4 | 10 | 2.5 | 0 | 8 |
| Team Total (HOU) | 22 | 48 | 2.2 | 0 | 10 |
| Team Total (NE) | 32 | 105 | 3.3 | 0 | 20 |
Receiving
| Player | REC | YDS | AVG | TD | LONG | TGTS |
|---|---|---|---|---|---|---|
| Jayden Higgins (HOU) | 6 | 59 | 9.8 | 0 | 16 | 10 |
| Dalton Schultz (HOU) | 2 | 47 | 23.5 | 0 | 42 | 2 |
| Xavier Hutchinson (HOU) | 4 | 44 | 11.0 | 0 | 23 | 13 |
| Harrison Bryant (HOU) | 3 | 21 | 7.0 | 0 | 9 | 6 |
| Christian Kirk (HOU) | 2 | 20 | 10.0 | 1 | 10 | 6 |
| Woody Marks (HOU) | 2 | 19 | 9.5 | 0 | 13 | 3 |
| Cade Stover (HOU) | 1 | 2 | 2.0 | 0 | 2 | 3 |
| Kayshon Boutte (NE) | 3 | 75 | 25.0 | 1 | 32 | 5 |
| Stefon Diggs (NE) | 4 | 40 | 10.0 | 1 | 14 | 6 |
| DeMario Douglas (NE) | 2 | 36 | 18.0 | 1 | 28 | 2 |
| Austin Hooper (NE) | 1 | 14 | 14.0 | 0 | 14 | 2 |
| Rhamondre Stevenson (NE) | 4 | 11 | 2.8 | 0 | 9 | 4 |
| Hunter Henry (NE) | 1 | 5 | 5.0 | 0 | 5 | 2 |
| TreVeyon Henderson (NE) | 1 | 2 | 2.0 | 0 | 2 | 2 |
| Team Total (HOU) | 20 | 212 | 10.6 | 1 | 42 | 45 |
| Team Total (NE) | 16 | 179 | 11.2 | 3 | 32 | 26 |
Turnovers
| Type | Texans | Patriots |
|---|---|---|
| Interceptions Thrown | 4 | 1 |
| Fumbles Lost | 1 | 2 |
| Total Turnovers | 5 | 3 |
Interceptions (Defense)
| Team | Player | INT | YDS | TD |
|---|---|---|---|---|
| Texans | Ja’Marcus Ingram | 1 | 0 | 0 |
| Patriots | Carlton Davis III | 2 | 0 | 0 |
| Patriots | Marcus Jones | 1 | 26 | 1 |
| Patriots | Craig Woodson | 1 | 0 | 0 |
Kicking
| Kicker | FG | FG% | LONG | XP | PTS |
|---|---|---|---|---|---|
| Ka’imi Fairbairn (HOU) | 3/3 | 100.0 | 51 | 1/1 | 10 |
| Andy Borregales (NE) | 0/0 | 0.0 | 0 | 4/4 | 4 |
Punting
| Punter | NO | YDS | AVG | TB | In 20 | LONG |
|---|---|---|---|---|---|---|
| Tommy Townsend (HOU) | 5 | 294 | 58.8 | 0 | 1 | 72 |
| Bryce Baringer (NE) | 8 | 333 | 41.6 | 0 | 3 | 55 |
Returns
| Return Type | Player | NO | YDS | AVG | LONG | TD |
|---|---|---|---|---|---|---|
| Kick Return (HOU) | Jaylin Noel | 3 | 69 | 23.0 | 26 | 0 |
| Kick Return (HOU) | Braxton Berrios | 1 | 19 | 19.0 | 19 | 0 |
| Kick Return (NE) | D’Ernest Johnson | 2 | 47 | 23.5 | 25 | 0 |
| Kick Return (NE) | Kyle Williams | 1 | 22 | 22.0 | 22 | 0 |
| Kick Return (NE) | Efton Chism III | 1 | 20 | 20.0 | 20 | 0 |
| Punt Return (HOU) | Jaylin Noel | 3 | 29 | 9.7 | 11 | 0 |
| Punt Return (NE) | Marcus Jones | 4 | 53 | 13.3 | 24 | 0 |
The Final Whistle: What the Scoreboard Doesn’t Show
The scoreboard is the headline. But it’s the last page of the book. The real story is in the chapters before. The NFL Texans vs Patriots match summary often shows a simple result. Maybe Patriots 25, Texans 22. A field goal difference. That’s it. But how did we get there? That’s where the magic lives.
Think of it like a pizza. The final score is the whole pie. The match statistics are the slices—the cheese, the sauce, the toppings.
You need to taste each part to know if it was truly good. Was the offense spicy? Was the defense crispy? The scoring breakdown shows you which quarters were flavorful and which ones fell flat.
A game can feel like a lifetime, especially in the fourth quarter. The clock moves slowly. Every yard is a war. The time of possession stat? That’s huge. It tells you who controlled the pace. Who made the other team’s defense tired? Who owned the game’s rhythm? It’s a silent bully.
Offensive Firepower: A Yard-by-Yard Grind
It is where games are won and or lost—moving the ball. The Texans ‘ and Patriots’ offensive stats show who was pushing forward and who was stuck in the mud. Let’s break it down.
The Air Attack: Passing Stats
The Texans vs Patriots passing stats are a quarterback’s report card. Completions. Attempts. Yards. Touchdowns. The ugly interceptions.
- Did the QB have time to throw?
- Were receivers getting open?
- The stat sheet knows.
A completion for 40 yards changes everything. It’s a lightning bolt. It shifts momentum. It makes the crowd scream. These big plays are hidden in the yardage comparison. Look for the average yards per pass. That number tells you about efficiency. Was it a dink-and-dunk day? Or were they throwing deep, daring shots?
The Ground Game: Rushing Stats
Now, the Texans vs Patriots rushing stats. It is about toughness. Grit. It’s about wanting those three hard yards when everyone in the stadium knows you’re running. The rushing yards per attempt is a powerful, simple number.
- 4.0 yards per carry is solid. You’re controlling the game.
- Under 3.0? You’re in trouble. The defense is winning.
First downs are the lifeblood of an offense. The Texans vs Patriots first-down stat is critical. How many came from runs? How many from passes? A team that converts third-and-short with a run is confident. It’s a statement.
Defensive Stands: Who Bent and Who Broke?
Defense wins championships. It’s a cliché because it’s often true. The Texans ‘ and Patriots defensive stats are the story of resistance. Of saying “no.”
A great defense isn’t always about flashy sacks. It’s about consistency. It’s about forcing punts and making a team settle for a field goal instead of a touchdown. The yardage comparison on defense shows who got pushed around. Giving up 150 rushing yards is a bad day. It means you couldn’t stop the engine.
Pressure is the quarterback’s nightmare. Sacks. Hurries. Knockdowns. These numbers might not be in the main box score, but they change games. A big hit on the QB can make him nervous for the next hour. He starts hearing footsteps. The team’s performance on defense is measured in stops. In red zone denials.
Think of a goal-line stand. The offense needs one yard. Four tries. The defense digs in. That’s pure heart. That energy isn’t in a stat line. But the resulting zero points are. That’s a win within the game.
The Turnover Tango: Game-Changing Moments
It is the game’s swing music. The Texans vs Patriots turnover stat is the biggest. A fumble. An interception. It’s a sudden shock. The crowd gasps. The whole stadium feels the change.
A turnover isn’t just losing the ball. It’s giving the other team hope—short field. Free points. Momentum shifts like a slammed door. The team that wins the turnover battle usually wins the game. It’s that simple. You can have more yards. More time. But lose the turnover battle? You’ll probably lose.
Recovering a fumble feels like finding money. Intercepting a pass is a theft in broad daylight. These moments live forever in highlights. They break hearts. They make heroes. Always check the turnover column first when looking at results and stats. It explains so much.
Key Players: The Heroes and the Almost-Heroes
People make stats. The Texans vs Patriots key players’ stats put names to the numbers. Who showed up? Who disappeared?
The quarterback is always under the microscope. His final line—passing yards, touchdowns, completions—is his legacy for the day. But what about the running back who fought for 12 tough carries? The wide receiver who made a circus catch on third down? The linebacker who had 14 tackles?
Sometimes the key players aren’t the stars. It’s the special teams ace who downed a punt at the one-yard line. That flipsthe whole field. It’s hidden in the team performance data. These efforts are the glue. They don’t always make the highlight reel. But coaches see them. Teammates feel them.
A quarterback can throw for 300 yards and lose. A running back can have 100 yards, and his team loses. Football is the ultimate team sport. The key players’ stats show individual brilliance. Or struggle. But they are just one piece of the giant, messy, beautiful puzzle.
Beyond the Box Score: The Stories in the Stats
The official Texans vs Patriots box score is a fossil. A record of what happened. But the why is in the details. The context.
- The Weather: Was it windy in Foxborough? Rainy in Houston? That wrecks passing games. It boosts running games. It changes everything.
- The Injuries: Did a star cornerback get hurt in the first quarter? Suddenly, the passing stats for the other team might look much better.
- The Momentum: A team can have terrible stats for three quarters. Then they get hot. They find a rhythm. The fourth-quarter scoring breakdown tells that tale of a comeback that almost was.
Reading NFL game stats is an art. You connect the dots. You see that a low time of possession led to a tired defense in the fourth quarter. You see that three straight three-and-outs gave the other team a short field. The numbers talk to each other. You have to listen.
Google Optimized FAQs
1. What were the final score and key stats from the latest Texans vs Patriots game?
The latest matchup was a close fight. For the exact final score, total yards, and the complete Texans vs Patriots box score, check the NFL’s official website or ESPN stats. The Texans vs Patriots results and stats always show a detailed quarter-by-quarter scoring breakdown and yardage comparison.
2. Who were the key players in the Texans vs Patriots game?
The Texans vs Patriots key players’ stats typically highlight the quarterbacks’ passing yards, the top rusher, and the leading receiver. Defensively, look for players with the most tackles, sacks, or interceptions. These stats define the team’s performance for the day.
3. How do the Texans and Patriots match up historically in head-to-head stats?
The Texans-Patriots head-to-head stats have been lopsided for years, heavily favoring New England, especially during the Tom Brady era. However, recent match statistics show a more competitive balance as both teams have undergone roster changes. The overall series record is available on pro-football-reference.com.
4. Which team won the turnover battle in the last Texans vs Patriots game?
The Texans vs Patriots turnover stat is crucial. In most of their games, the team that committed fewer turnovers won. To see who had more interceptions and fumbles lost in their last meeting, review the full game stats summary on any major sports analytics site.
5. What was the time of possession in the last Texans vs Patriots matchup?
The Texans ‘ and Patriots time of possession is a telling stat. Controlling the clock often correlates with victory. In their recent games, the team that held the ball longer usually had more success running their offense and resting their defense. This figure is always listed in the detailed match statistics.
The Takeaway: Stats Are a Language
So there you have it. The Texans vs Patriots latest stats aren’t just cold numbers on a screen. They are a live broadcast of effort, strategy, and chance. The Texans vs Patriots match statistics give you the power to see the game deeper. To understand the grind behind the glory.
Next time you see a Texans vs Patriots game stats recap, you’ll see more. You’ll know the story of a defensive stand. The echo of a turnover. The slow burn of a long drive that ate the clock. The numbers have a heartbeat. Your job is to listen. Now, find that box score and read it like a novel. The best one you’ll read all week.
References:
- Official NFL Game Statistics & Information: [www.nfl.com/stats/]
- ESPN NFL Scoreboards and Box Scores: [www.espn.com/nfl/]
- Pro Football Reference for Historical Head-to-Head Data: [www.pro-football-reference.com/]
- Team Performance Metrics & Advanced Analytics: [Next Gen Stats on NFL.com]
Disclaimer: This article provides an analytical breakdown of game statistics. All team names, logos, and referenced game events are the property of the NFL and its respective teams. Specific game outcomes and stats referenced are based on historical patterns and are for illustrative and analytical purposes.
Read More: Nuggets vs Mavericks Latest Match Stats